These charts make a few assumptions. Since each person's can have a different starting salary and starting date, these charts show an employee that started in 1999 and their starting salary was midpoint for that paygrade.
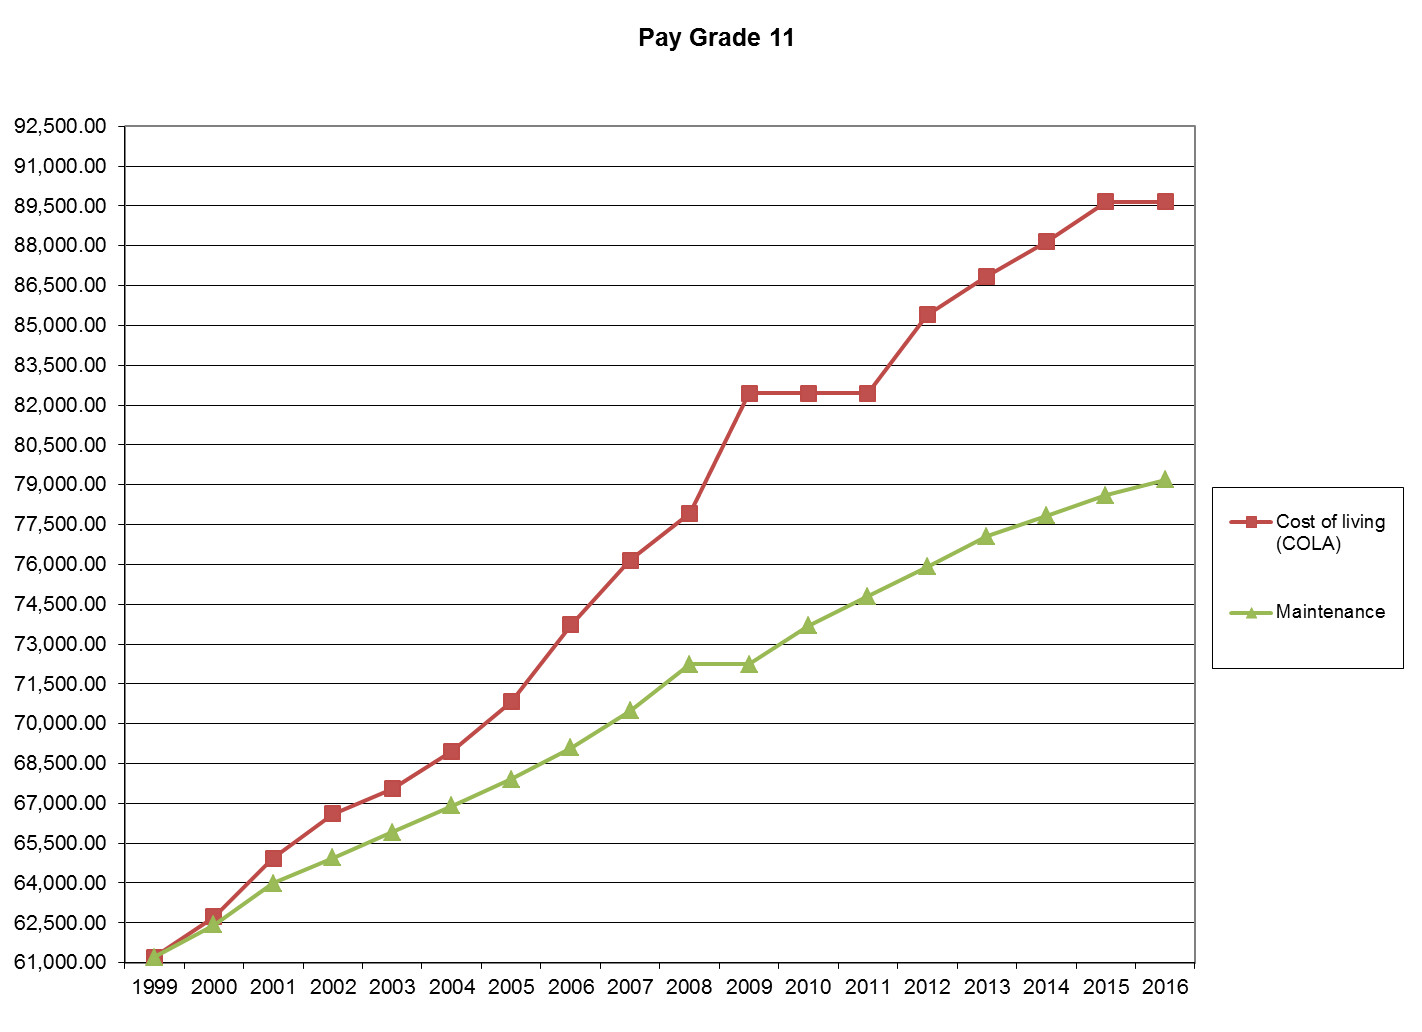
This first chart shows a person that meet standards and received the maintenance raise every year.
This chart shows two lines. The first is the cost of living which is based on Social Securities Cost-Of-Living Adjustments (COLA). The second is the salary after their maintenance raise.
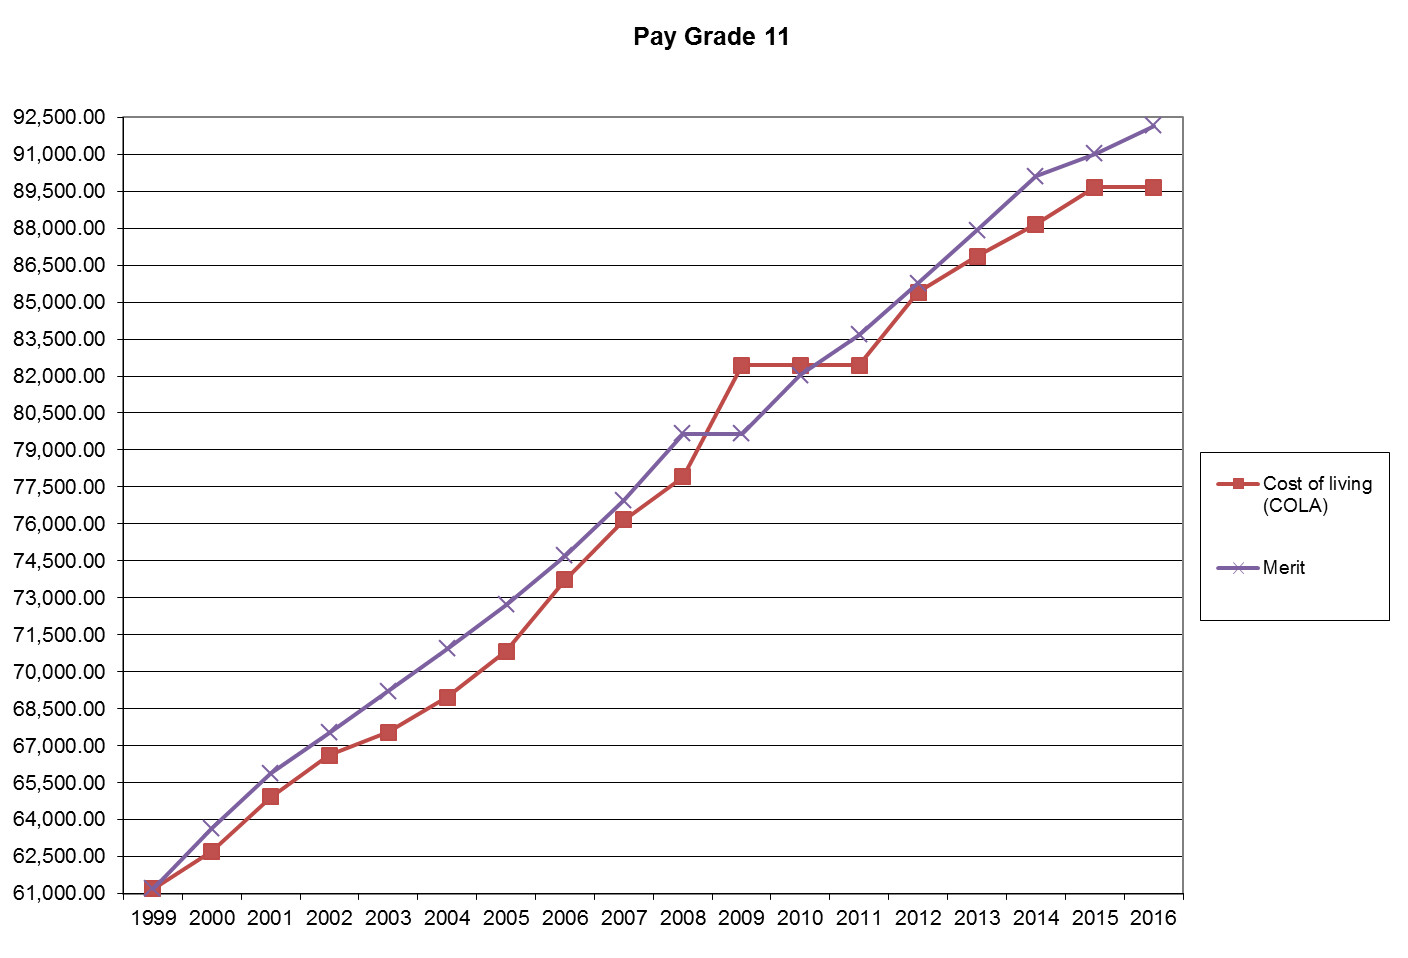
The second chart also shows two lines. As with the last chart, the first is the cost of living which is based on Social Securities Cost-Of-Living Adjustments (COLA). The second is the salary after receiving both the maintenance raise and the full merit raise.
The COLA rates for Social Security increases can be found at: